Mapping Your Value Stream: The Data-Driven Path to Engineering Flow

When software delivery feels chaotic, characterized by stagnant deployment frequency, creeping lead times, and an alarming change failure rate, the engineering data you already collect is the key to clarity. As an engineering leader, I once faced the piercing question: “Where exactly does our time go?” That moment launched me into Value Stream Mapping (VSM), and what I discovered, powered by a unified data platform, completely transformed our operations.
The reality is that VSM is no longer a manual, lean manufacturing exercise. When combined with modern engineering intelligence platforms like Evolvedev.io, it becomes a live, data-backed diagnostic tool that tells the full story of value creation and waste across your software development lifecycle.
From Siloed Data to Unstoppable Flow
The biggest friction point in VSM is often the initial data collection. Your core systems, GitHub, Jira, Slack, and email hold the necessary truth, but the data is scattered. The breakthrough, and the essence of Evolvedev.io, is the unification of these sources into a single, connected view.
Here is the data-driven approach we took to transform our flow:
1. The Real-Time Map of Your Current State
We started with our critical value stream: feature development from code commit to production. The key was a platform that could automatically pull data from our tools to generate core flow metrics. No more manual spreadsheets, just seamless integration providing immediate, uncomfortable truths:
- Bottlenecks Revealed: Our map instantly highlighted a five-day wait time in code review for a specific module. We discovered that nearly 40% of our total lead time was spent in an idle, waiting state, not active work.
- The Investment Reality: Our Investment Dashboard is actually going versus where we thought it was going, allowing us to have data-backed debates about "bandwidth."
2. Custom Dashboards: Your Command Center for Excellence
The difference between a static VSM diagram and a truly effective system is the live, diagnostic dashboard. We moved beyond static reporting to create a dynamic command center:
- DORA & Flow Metrics: We implemented live dashboards tracking the full spectrum of metrics: Deployment Frequency, Lead Time for Changes, Change Failure Rate, and Mean Time to Recovery. These metrics are the foundation for achieving DORA's Elite performance.
- The Power of Flow Metrics: To truly understand the why, we leveraged key Flow Measurements, all automatically calculated by the intelligence platform:
- Flow Efficiency: Exposed that only 35% of our time was active work, the other 65% was waste (idle time or unnecessary friction). This is your massive cost-saving opportunity.
- Flow Load: Demonstrated that we were consistently overloading our teams with too many work items in progress, a direct cause of burnout and slow delivery.
- Proactive Risk Management: The Notification Manager became our early warning system. We set automated alerts for when Flow Efficiency dropped below a certain threshold or when a code review stalled for more than four hours, turning risks into immediate, actionable tasks delivered directly to Slack or email.
3. Achieving the Future State: Measurable Impact
Armed with this visibility, our future-state plan was based purely on data. We weren't guessing; we were targeting the biggest points of friction identified by the map.
In just three months, the results were clear and measurable:
- Delivery Pace: Deployment Frequency moved from weekly to multiple times daily.
- Lead Time: Lead Time for Changes fell from 18 to 11 days.
- Stability: Change Failure Rate dropped from 12% to under 5%, cementing our status in the "Elite" category for delivery performance.
- Resource Value: We got more done with the same engineering resources by eliminating hidden waste and keeping our people focused and happier.
The Path Forward: Visibility is the Ultimate ROI
The future of software delivery belongs to leaders who view their development process as a measurable, optimizable system. Value Stream Mapping, when powered by a unified engineering intelligence platform like Evolvedev.io, gives you:
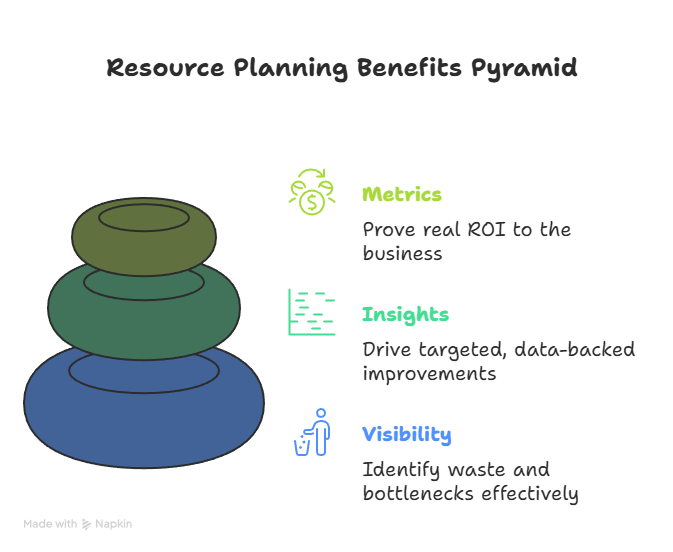
- The Visibility to identify waste and bottlenecks.
- The Insights to drive targeted, data-backed improvements.
- The Metrics to prove real ROI to the business.
We learned that you can't optimize what you can't see. By unifying your data and visualizing your value stream, improvement isn't just a goal, it becomes an inevitable outcome.
Evolvedev.io: The Engine for Continuous VSM
This level of flow optimization is impossible with manual effort.
It doesn't just give you static metrics; it provides real-time, actionable insights via its Custom Dashboards and Notification Manager to ensure your VSM isn't a one-time project but a living, continuous improvement system.
Evolvedev.io transforms the abstract concept of flow into a data-driven reality, empowering you to become a 5X to 10X+ Revenue Architect for your organization by optimizing your engineering investment.
Are you ready to stop guessing where your time goes and start mapping your team's path to Elite performance?