3-D View of Engineering Productivity

You are always under pressure as a leader in engineering. The market wants new ideas, the business wants features faster, and you have to deliver.
The first thing that always comes to mind is, "How can we get our teams to work harder?" For decades, we've tried to answer this with simple, one-dimensional numbers. Lines of code. Points in the story. We all know deep down that these don't tell the whole story.
Fortunately, "A Software Development Productivity Framework" by Catlin Sadowski, Margaret-Anne Storey, and Robert Feldt is an outstanding work that gives us a much better way to think about this.
It backs up what a lot of us have thought: engineering productivity isn't just a number. It's a complicated idea with many parts.
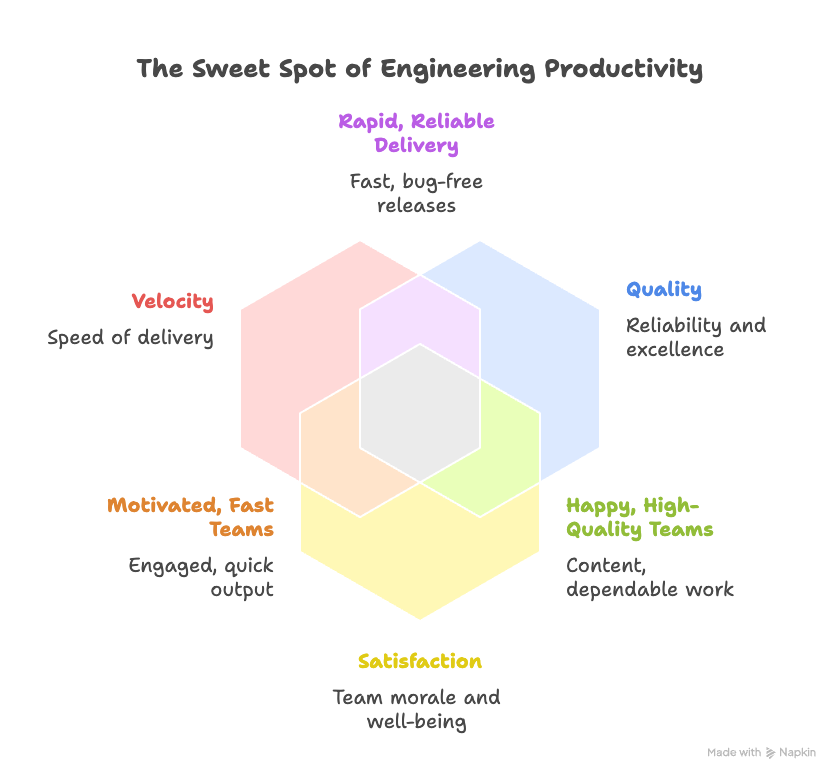
Based on their framework , I think the best way to look at productivity is in three dimensions.
Dimension 1: Velocity (The Need for Speed 🏎️)
Let's be clear: speed is important. Velocity is how quickly your team can turn an idea into something useful for the customer. The rhythm of your delivery engine is what it is. We're talking about important metrics like Cycle Time, Deployment Frequency, and Lead Time for Changes.
But only looking at speed is like driving a car and only looking at the speedometer. Are you going the right way, though? You might be going fast. And is the engine going to blow up? The best way to build up technical debt and wear out your best people is to always push for speed.
Dimension 2: Quality (The Foundation of Value 💎)
If what you're shipping is broken, high speed doesn't matter. Quality is what makes speed last. It's all about how well the job gets done. Low quality doesn't just make users angry; it also starts a cycle of fixing bugs, doing extra work, and putting out fires that slows down progress.
Not having bugs isn't the only thing that makes something good. It includes how strong your architecture is, how clear your code is, and how reliable your systems are. You can start to see how much bad quality costs when you keep track of things like the Change Failure Rate, the percentage of work that needs to be redone, and the time spent fixing bugs compared to adding new features.
Dimension 3: Satisfaction (The Engine of Innovation 😊)
This is the part that most leaders don't pay attention to, but it's probably the most important. The long-term success of your team depends on how happy developers are. Are your engineers happy? Do they have long periods of time when they can focus without being disturbed? Do they feel safe and free to make their own decisions?
A team that isn't happy isn't working well. They're more likely to cut corners, less likely to work together well, and much more likely to quit. A high turnover rate among developers is a silent killer of productivity. When you lose an experienced engineer, you don't just lose the work they did; you also lose their knowledge of the company, their ability to mentor others, and their ability to come up with new ideas. Satisfaction isn't just a "nice-to-have"; it's a direct sign of how fast and well your team will work in the future.
The Productivity Triangle: Finding the Balance
Here’s the critical insight: Velocity, Quality, and Satisfaction are in constant tension. You can't maximize one without affecting the others.
- Push Velocity too hard -> Quality drops and Satisfaction plummets.
- Demand perfect Quality -> Velocity slows to a crawl.
- Optimize only for Satisfaction -> You might have a happy team that isn't shipping.
The goal of elite engineering leadership isn't to max out one metric. It's to find the optimal balance between all three. But how can you balance what you can't see?
You Can't Fix What You Can't See.
This is where the rubber meets the road. You can't manage this delicate balance by relying on gut feelings and endless status meetings. You need a single source of truth that gives you a holistic, data-driven view across your entire engineering organization.
That's exactly why we built EvolveDev.io.
EvolveDev is the software engineering intelligence platform that brings these three dimensions into focus. It integrates seamlessly with the tools you already use—GitHub, Jira, Bitbucket, Slack—to automatically collect and analyze the data you need.
- See Your Velocity: Track real-time DORA metrics and project cycle times without manual data entry.
- Understand Your Quality: Pinpoint where rework is happening, identify code churn, and see how engineering effort is split between new features, maintenance, and bug fixes.
- Protect Your Team's Satisfaction: Identify bottlenecks that frustrate developers, visualize meeting overhead, and ensure your teams have the focus they need to do their best work.
Stop guessing. It's time to move beyond simplistic metrics and start leading with a complete, three-dimensional picture of your team's performance.
Ready to achieve true engineering excellence?
Book a demo of EvolveDev.io today and see the full picture.